Software for Home Builders and Condo Builders |
|
|
|
||
|
|
H.O.M.E.S. Sample Report |
|
|
|
||
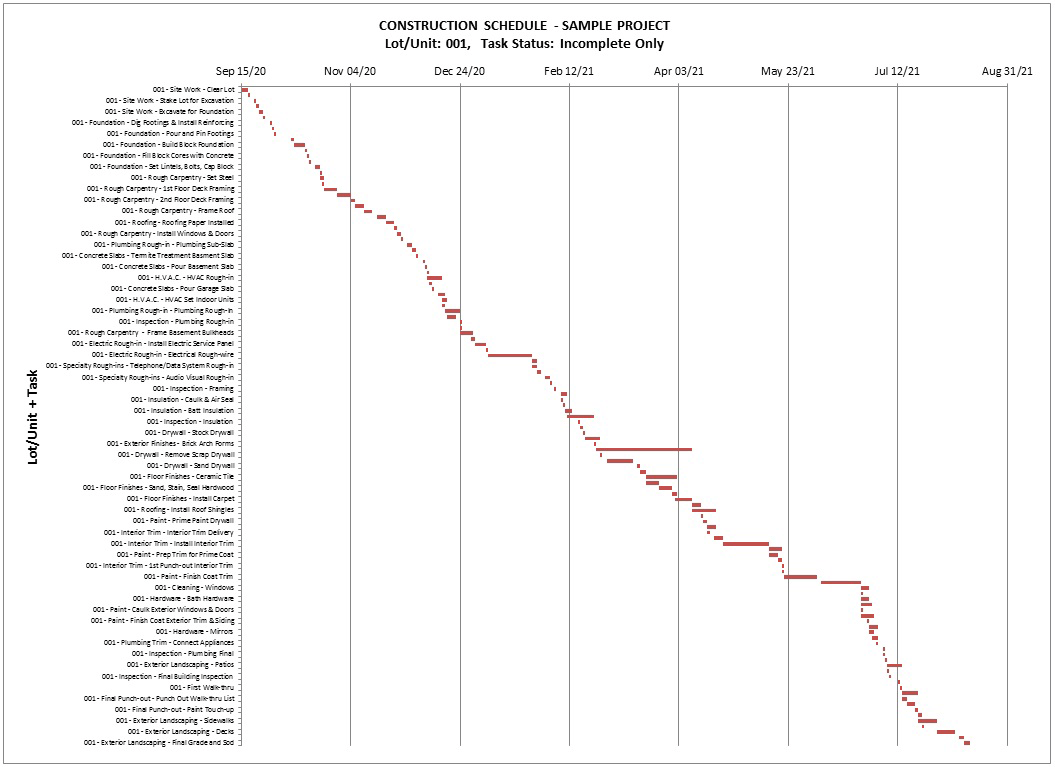
Construction Schedule Gantt Chart (Full - 1 Lot/Unit) |
|
Please Note: The report has been shrunk down and converted to an image for those viewing with small screens. The actual reports are much more clear. |
 |
|
The Construction Schedule Gantt Chart displays visually the construction schedule timeline based on your preferences. It's a great tool to get an overview of scheduling of production tasks and can be filtered by Lot/Unit, Trade category, Contractor, Worker/Team, Dates, specific tasks or groups of tasks etc in any combination. This example displays the timeline for all tasks for a specific Lot/Unit.
H.O.M.E.S. automates Microsoft Excel®
to automatically generate and display the fully formatted chart
as displayed. |
| Home About Us Products Support News Contact Us Sitemap |
|
© 2000-2026 Falcon Software (All rights reserved) |